
When to Catch a Falling Knife
What technical analysis can teach a fundamental investor about when to buy

You did the work. You read five years of filings, listened to the earnings calls, and built the conviction.
The business earns returns well above its cost of capital, the reinvestment runway is long, and the people running it own a meaningful slice. You did the valuation, thought it was fairly valued, and so you took a position.
And then the stock falls.
Not for a day, or a week.
For months.
You watch the fundamentals, quarter after quarter. Revenue growth is fine, the moat is intact, and management is doing what they said they’d do.

You even see insider buying.
But the shares keep sliding. Some days you’re sure the market knows something you don’t. Other days you’re sure the market is a panic of strangers selling for reasons that have nothing to do with the company.
All true, and yet note the underlying assumption, that the falling price carries no information at all, that it’s all noise, and with no signal. Is that true?
What if fundamentals and price action answer two different questions?
What if those questions are complementary?
Can a fundamental investor learn to both read the balance sheet and the chart?
An Ecosystem, not a Calculator
The efficient-market picture treats the market as a calculator. Information arrives, rational investors agree on what it means, the price adjusts, and we move on. In that world, trading is modest and large moves only follow large news.
Michael Mauboussin’s 2002 paper, Revisiting Market Efficiency: The Stock Market as a Complex Adaptive System, points out how badly this matches the tape. Returns are not normally distributed; the tails are far too fat.
Fama himself noted, back in 1965, that under a normal distribution a five-standard-deviation daily move should turn up about once every 7,000 years. In reality, Mauboussin observes, such moves arrive every three or four years.
On October 19, 1987, the S&P 500 fell 22.6% on no news that any calculator could price. The calculator model can’t account for that day, so it files it under “mistake” and keeps the model.
Mauboussin’s alternative borrows from biology.
The market is a complex adaptive system. It is a large population of heterogeneous agents - value investors, quant funds, index flows, leveraged traders, retail - each operating on its own decision rules, and adapting those rules in response to outcomes.
This creates order without an organizer, the way a flock of birds wheels in unison with no bird in charge, each one simply reacting to its neighbors.
In an ecosystem of diverse rules, the agents mostly cancel each other out, and price stays close to a reasonable estimate of value - errors that are independent of one another wash out in the aggregate.
The system works precisely because of its diversity.
And as we have seen, diversity can collapse. When a catalyst causes enough agents to start following the same rule (or, the same subreddit) their errors stop being independent and start to compound.
Mauboussin calls these moments diversity breakdowns, and they are when the ecosystem becomes fragile. A small stimulus tips a system already loaded with correlated behavior, the way one more grain tips a sand pile that has built to its critical angle. The avalanche looks like it had a cause proportional to its size, when it didn’t.
So the answer to the question - is the falling price information or noise? - is that it can be either, and the two look identical on any given day. Sometimes price is the aggregated judgment of a diverse crowd. Sometimes price is a momentary monoculture, a stampede of investors all running the same rule at once.
The shortcoming of fundamental analysis is that it tells you the health of the underlying organism, without telling you about the health of the overall flock.
This is the first half of the case for looking at price. Not to value the business, but to read the behavior of the crowd. He’s explicit that discounted cash flow remains the key to value; while price movements reflects the crowd, not the business.
That division of labor is what we want to explore further.
“We Belong Together”
If price action and fundamentals are truly complementary, the complementarity should show up in returns data, across markets, over decades.
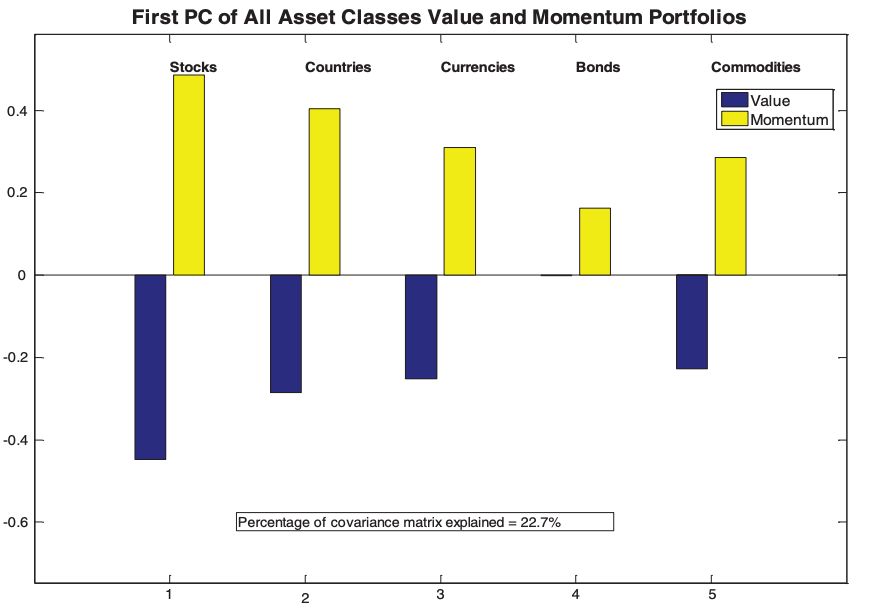
Cliff Asness, Toby Moskowitz, and Lasse Pedersen’s 2013 study, Value and Momentum Everywhere examined value and momentum jointly, across eight diverse markets and asset classes at once.
Value was defined as cheap relative to some measure of worth. Momentum was defined as what goes up keeps going up. The first is the discipline of the value investor. The second is the discipline of the chart-reader.
The results were that both show up nearly everywhere. Value earns abnormal returns across asset classes, and so does momentum. Interestingly, this appears in asset classes outside of equities, such as government bonds and currencies. The pattern held across eight different arenas with different participants, structures, and securities. That ubiquity is itself the argument - these are not artifacts of one market.
Perhaps unsurprisingly, both strategies were positively correlated across otherwise unrelated markets - cheap stocks in Japan move with cheap currencies, and momentum is likewise correlated with momentum globally.
Yet value and momentum are negatively correlated with each other, both within an asset class and across them. When value is suffering, momentum tends to be working. When momentum breaks, value tends to be carrying the load.
Why would that be, beyond a statistical accident?
The authors trace part of it to global liquidity supply and demand dynamics. Momentum tends to do well when liquidity is ample and trends can run, and it gets hurt when liquidity suddenly dries up and crowded positions unwind.
Value carries the opposite exposure - it suffers as liquidity tightens and cheap things get cheaper, and it pays off as conditions normalize and the gap to fair value closes. The two strategies load on the same risk with opposite sign, where one tends to be a shock absorber for the other.
Thus, the value investor’s deepest vulnerability is being early - right about the business, right about the value, and yet forced to sit through a long painful share price drawdown before the market finally agrees.
Said another way, rarely does the investor get to make a smart value buy and have a favourable price trend.
The Signal in the Noise
We still face the oldest objection, and it is a good one - most of what passes for technical analysis is people seeing faces in clouds.
Support levels, head-and-shoulders, a trendline drawn through whatever points flatter the story you already wanted to tell. Chart doesn’t fit your preconceived ideas? Change the reference timeline until it does!

Burton Malkiel’s verdict was that under scientific scrutiny, chart-reading “must share a pedestal with alchemy.” How do we find the signal, when there’s boundless noise?
Enter Andrew Lo, Harry Mamaysky, and Jiang Wang’s 2000 paper, Foundations of Technical Analysis. Their insight was that the subjectivity is the problem - the pattern is in the eye of the beholder - so they removed the beholder.
They built an algorithm that detects classic formations mechanically, the same way every time, with no human deciding after the fact whether a wiggle “counts.” They ran it across US stocks from 1962 to 1996, thirty-one years, computing the returns that follow each pattern strictly out of sample.
Interestingly they found that several patterns carry real, measurable information. For NYSE and AMEX stocks, five of the ten formations they tested - head-and-shoulders, broadening bottoms, rectangle tops, rectangle bottoms, and double tops - produced statistically significant differences in the return distribution, and the patterns were even more informative among Nasdaq names.
We find that certain technical patterns, when applied to many stocks over many time periods, do provide incremental information, especially for Nasdaq stocks.
The reason is that prices are made by people, and people respond to fear, greed, and anchoring in repetitive ways. We are all ultimately slaves to our psychology, and a price pattern is a reflection of the crowd’s psychology.
So twenty-six years later, why aren’t we all disciples of technical analysis?
…this does not necessarily imply that technical analysis can be used to generate “excess” trading profits, it does raise the possibility that technical analysis can add value to the investment process.
A signal can be statistically real and still be uneconomic to harvest, because every time you act on it you pay a spread, a commission, a tax, and a slice of slippage. Or, someone else (like a front running hedge fund, for example) beats you to the punch.
However for a long-term investor the value proposition inverts. That same friction that is uneconomical for the day-trader is a valid data point for an investor trying to decide if they start a position this month or next.
Used that way, price signals aren’t to be traded, they are to be overlaid on top of fundamental analysis.
The Rules of Engagement
So we have three findings that point the same direction. The market is an adaptive crowd whose moods are not assessed with a 10-K (Mauboussin). A price-based factor diversifies a fundamental one because their worst days don’t coincide (Asness, Moskowitz, and Pedersen). Price patterns carry genuine, if modest, information, that in and of itself is difficult to exploit (Lo, Mamaysky, and Wang).
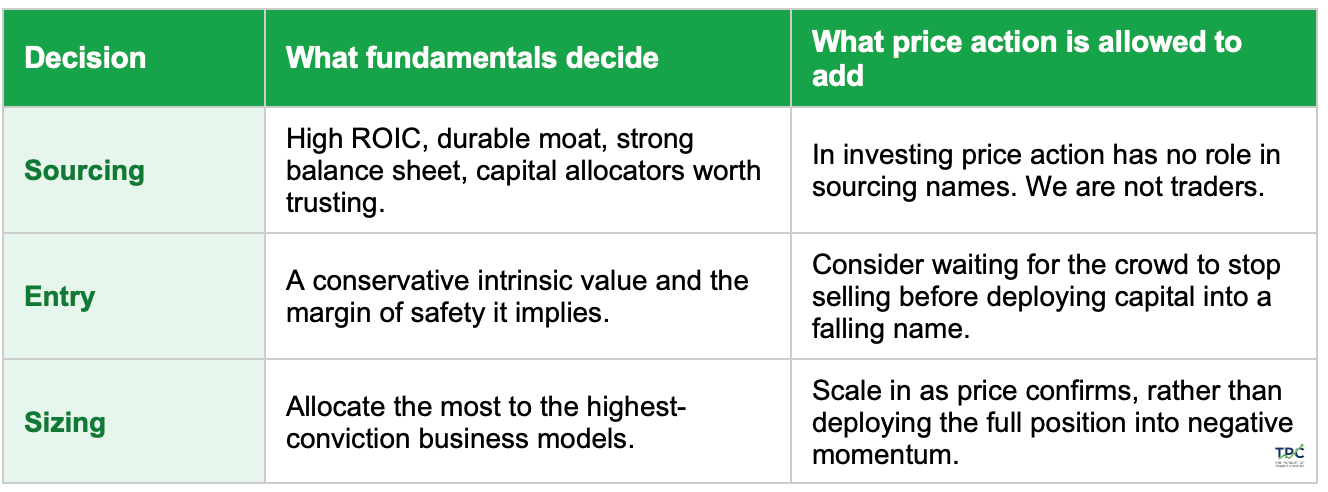
We can then codify a division of labor that can be applied to any fundamental analysis.
Fundamentals decide what you own and whether you should. Price action only ever gets a vote on when, after the fundamental case is already made. Fundamentals first, technical overlay second.
Borrowed conviction from a chart is the worst kind of conviction, because it evaporates the moment the chart turns and leaves you holding a thing you never understood.
The Tools
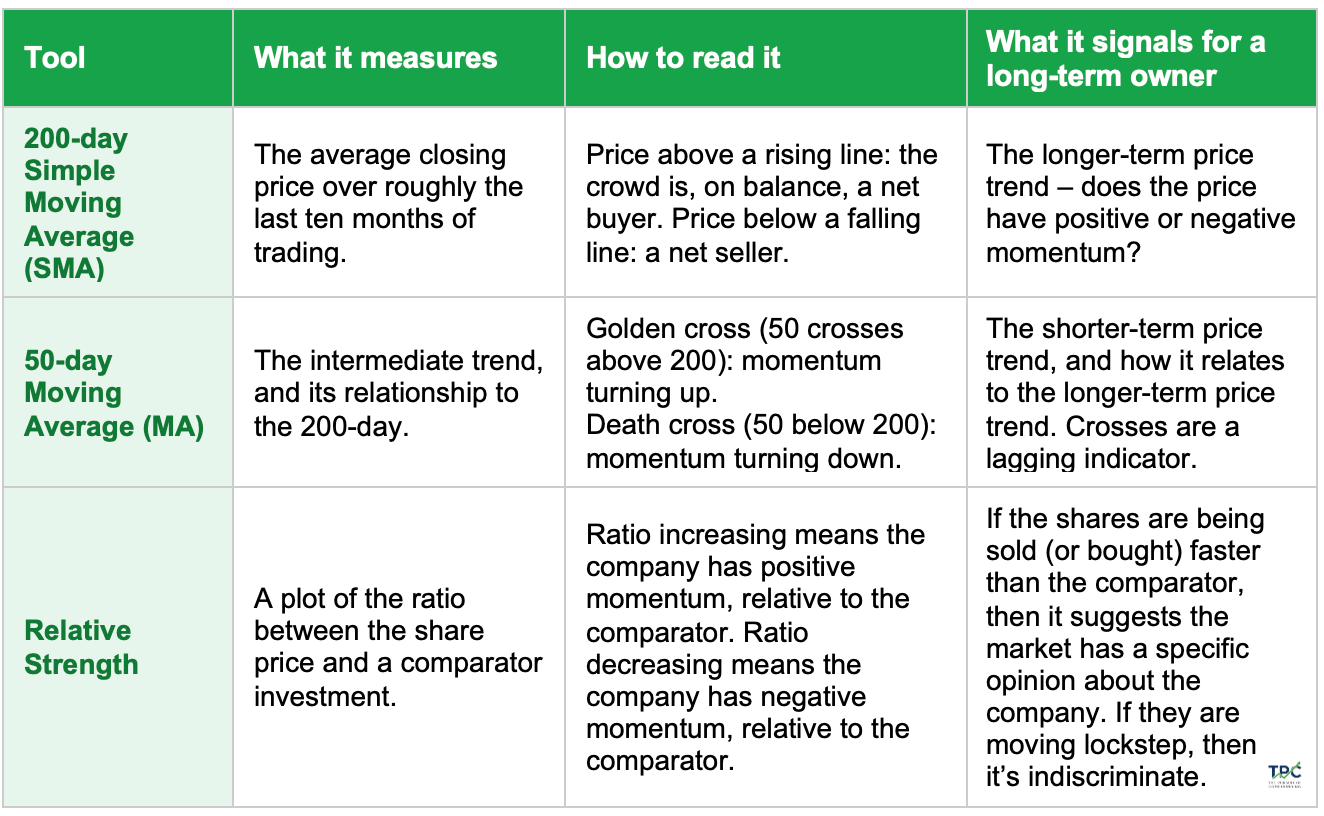
That table is the philosophy. Here are the specific tools, chosen on one criterion: they are slow enough that acting on them keeps turnover low, which is the only way the Lo, Mamaysky, and Wang friction lesson lets you use price action without bleeding the edge away. A long-term owner needs a small dashboard, not a cockpit.
The 200-day simple moving average is the primary instrument. It’s the average closing price over roughly the last ten months of trading, and it functions as the dividing line between an uptrend regime and a downtrend regime. Price above a rising 200-day means the crowd, on balance, is still a buyer; price below a falling 200-day means the crowd, on balance, is still a seller.
The 50-day average is the intermediate trend, and its relationship to the 200-day is the one cross worth watching. When the 50-day falls through the 200-day from above, it’s a death cross - the regime has turned down. When it climbs back through from below, it’s a golden cross - the regime is turning up. These are lagging by design; they will never catch the exact turn. For a buy-and-hold investor, lagging is exactly what you want, because it filters out the head-fakes that shake out the impatient.
Relative strength (not to be confused with Relative Strength Index (RSI)) indicates if the shares are falling with the group or faster than the group. This is the Mauboussin diversity-breakdown test in action. If a quality name is falling no faster than the market around it, then the selling is indiscriminate. On the other hand, if it’s falling faster than the basket, the market may be telling you something about the business itself, and you owe the fundamentals a second look.
That’s the whole kit - one regime line, one cross, and one relative-strength check. None of it confirms or refutes a fundamental thesis. Instead, it answers the single question fundamentals can’t - is the crowd buying or selling?
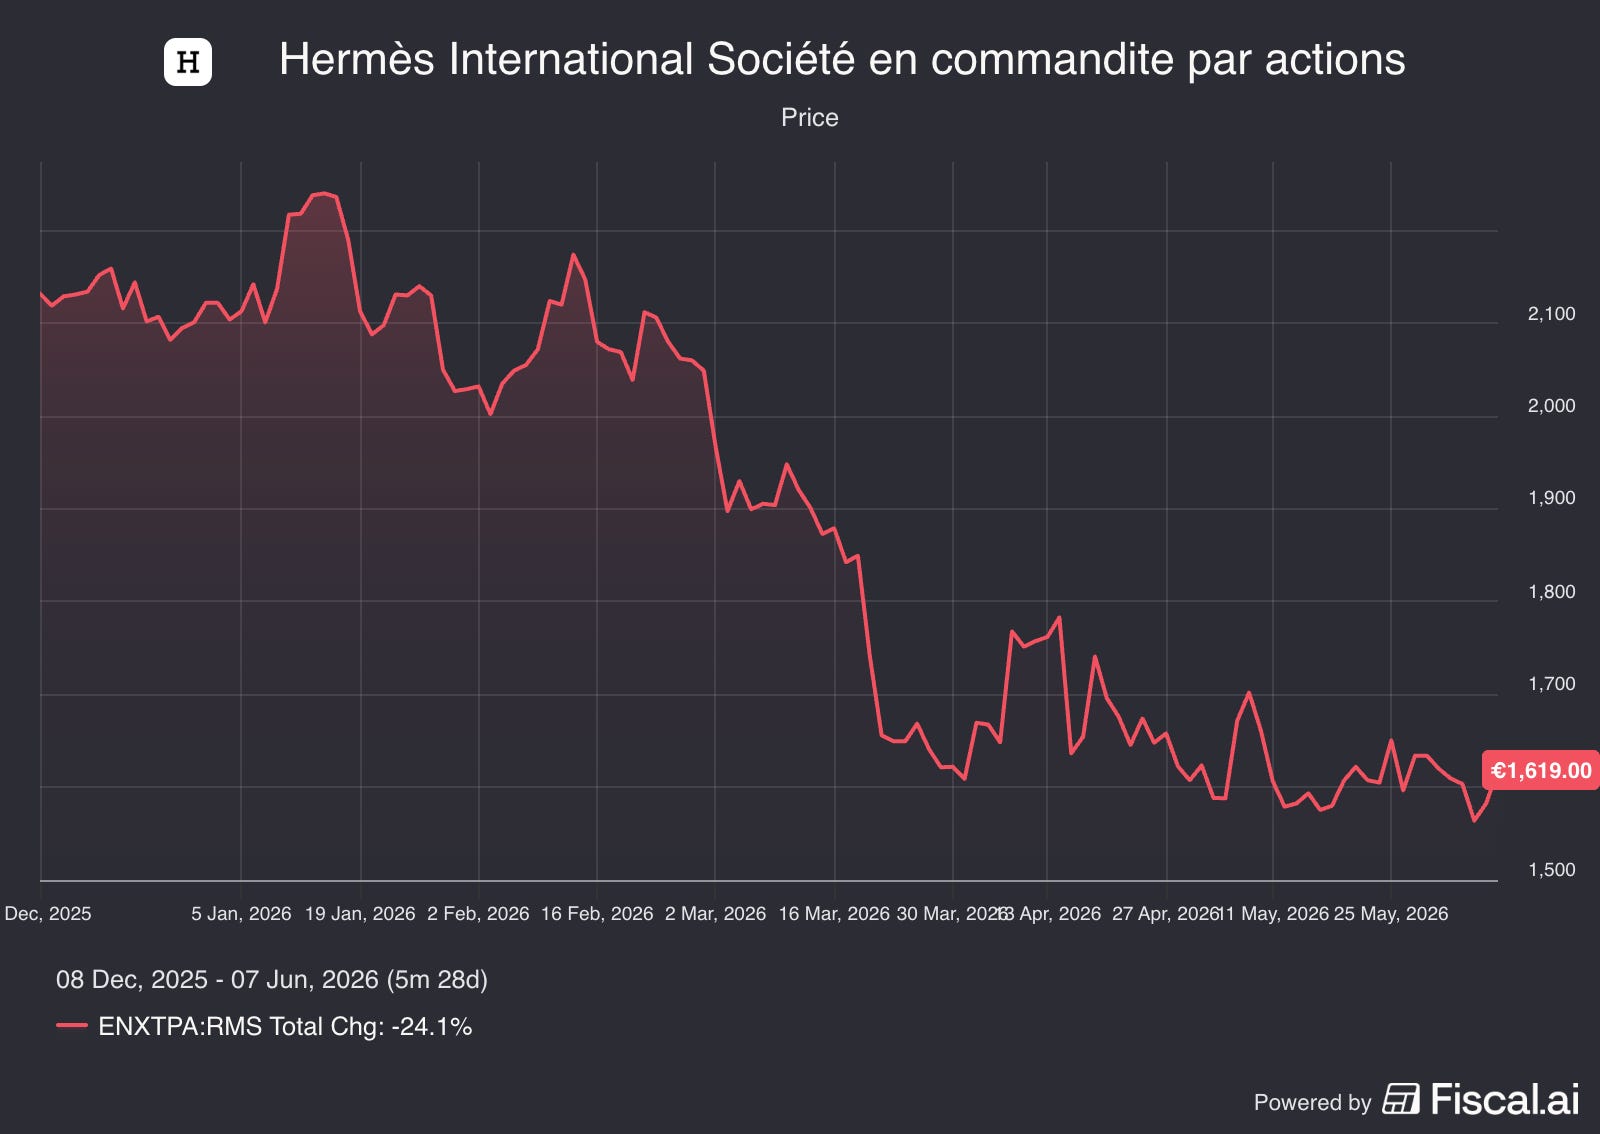
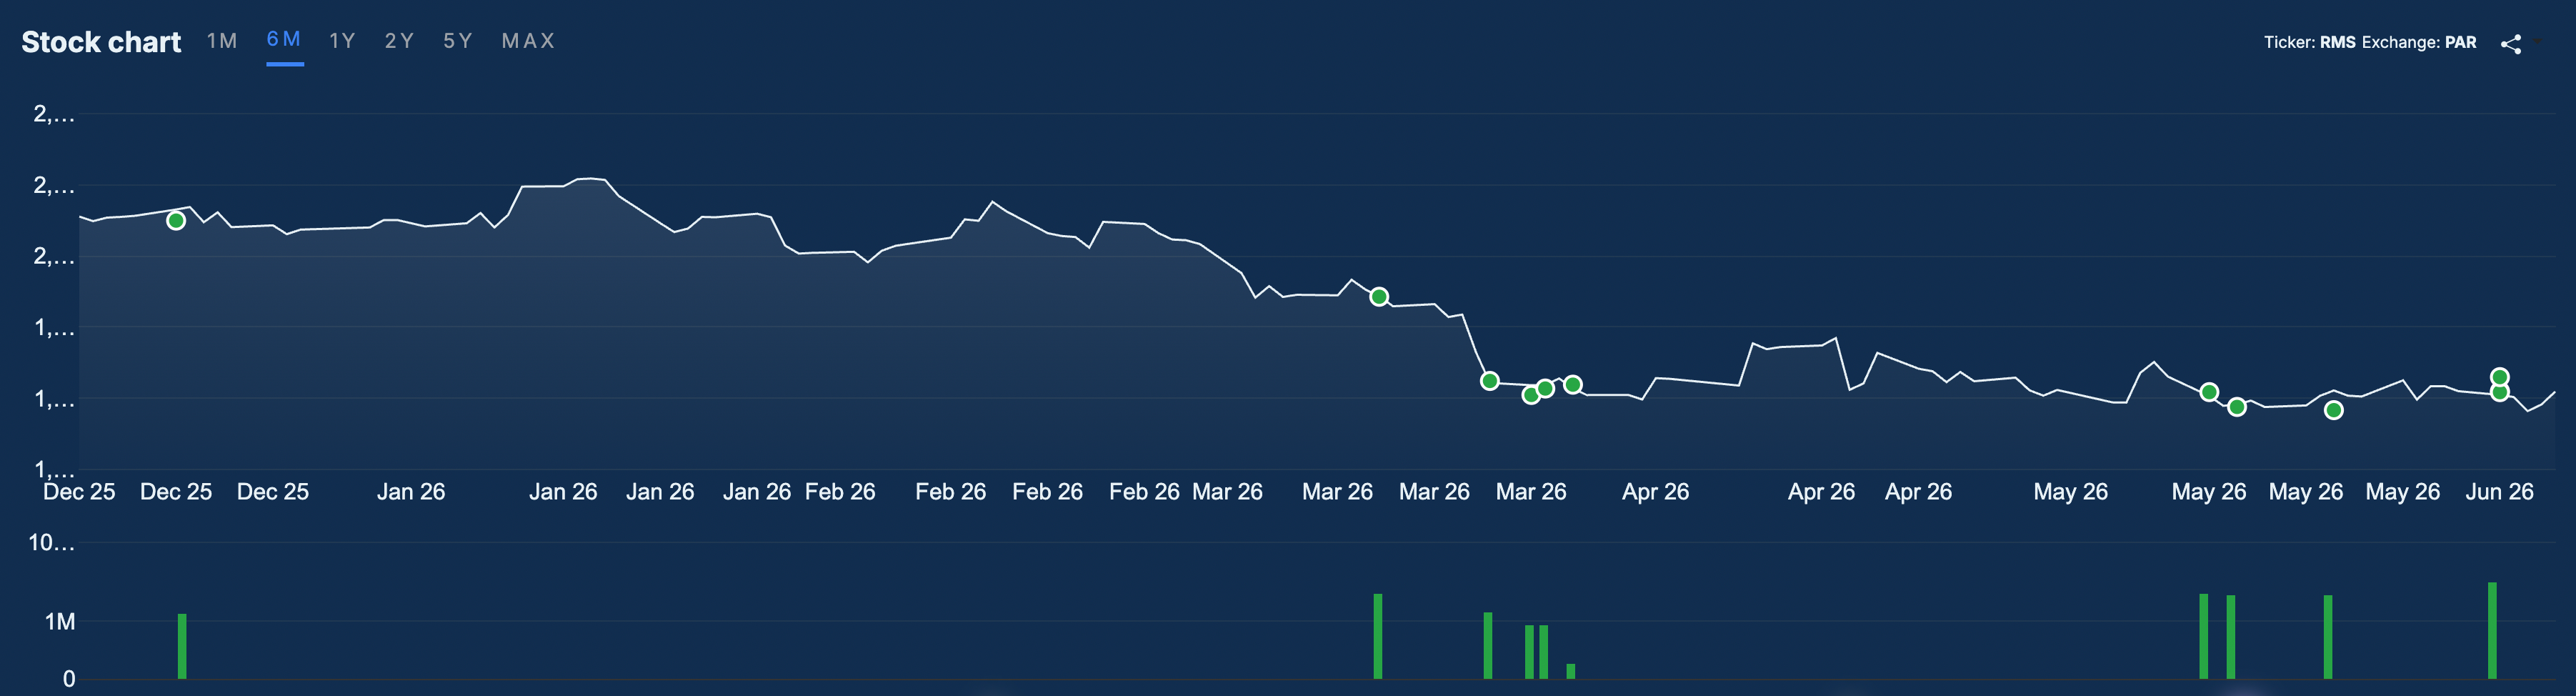
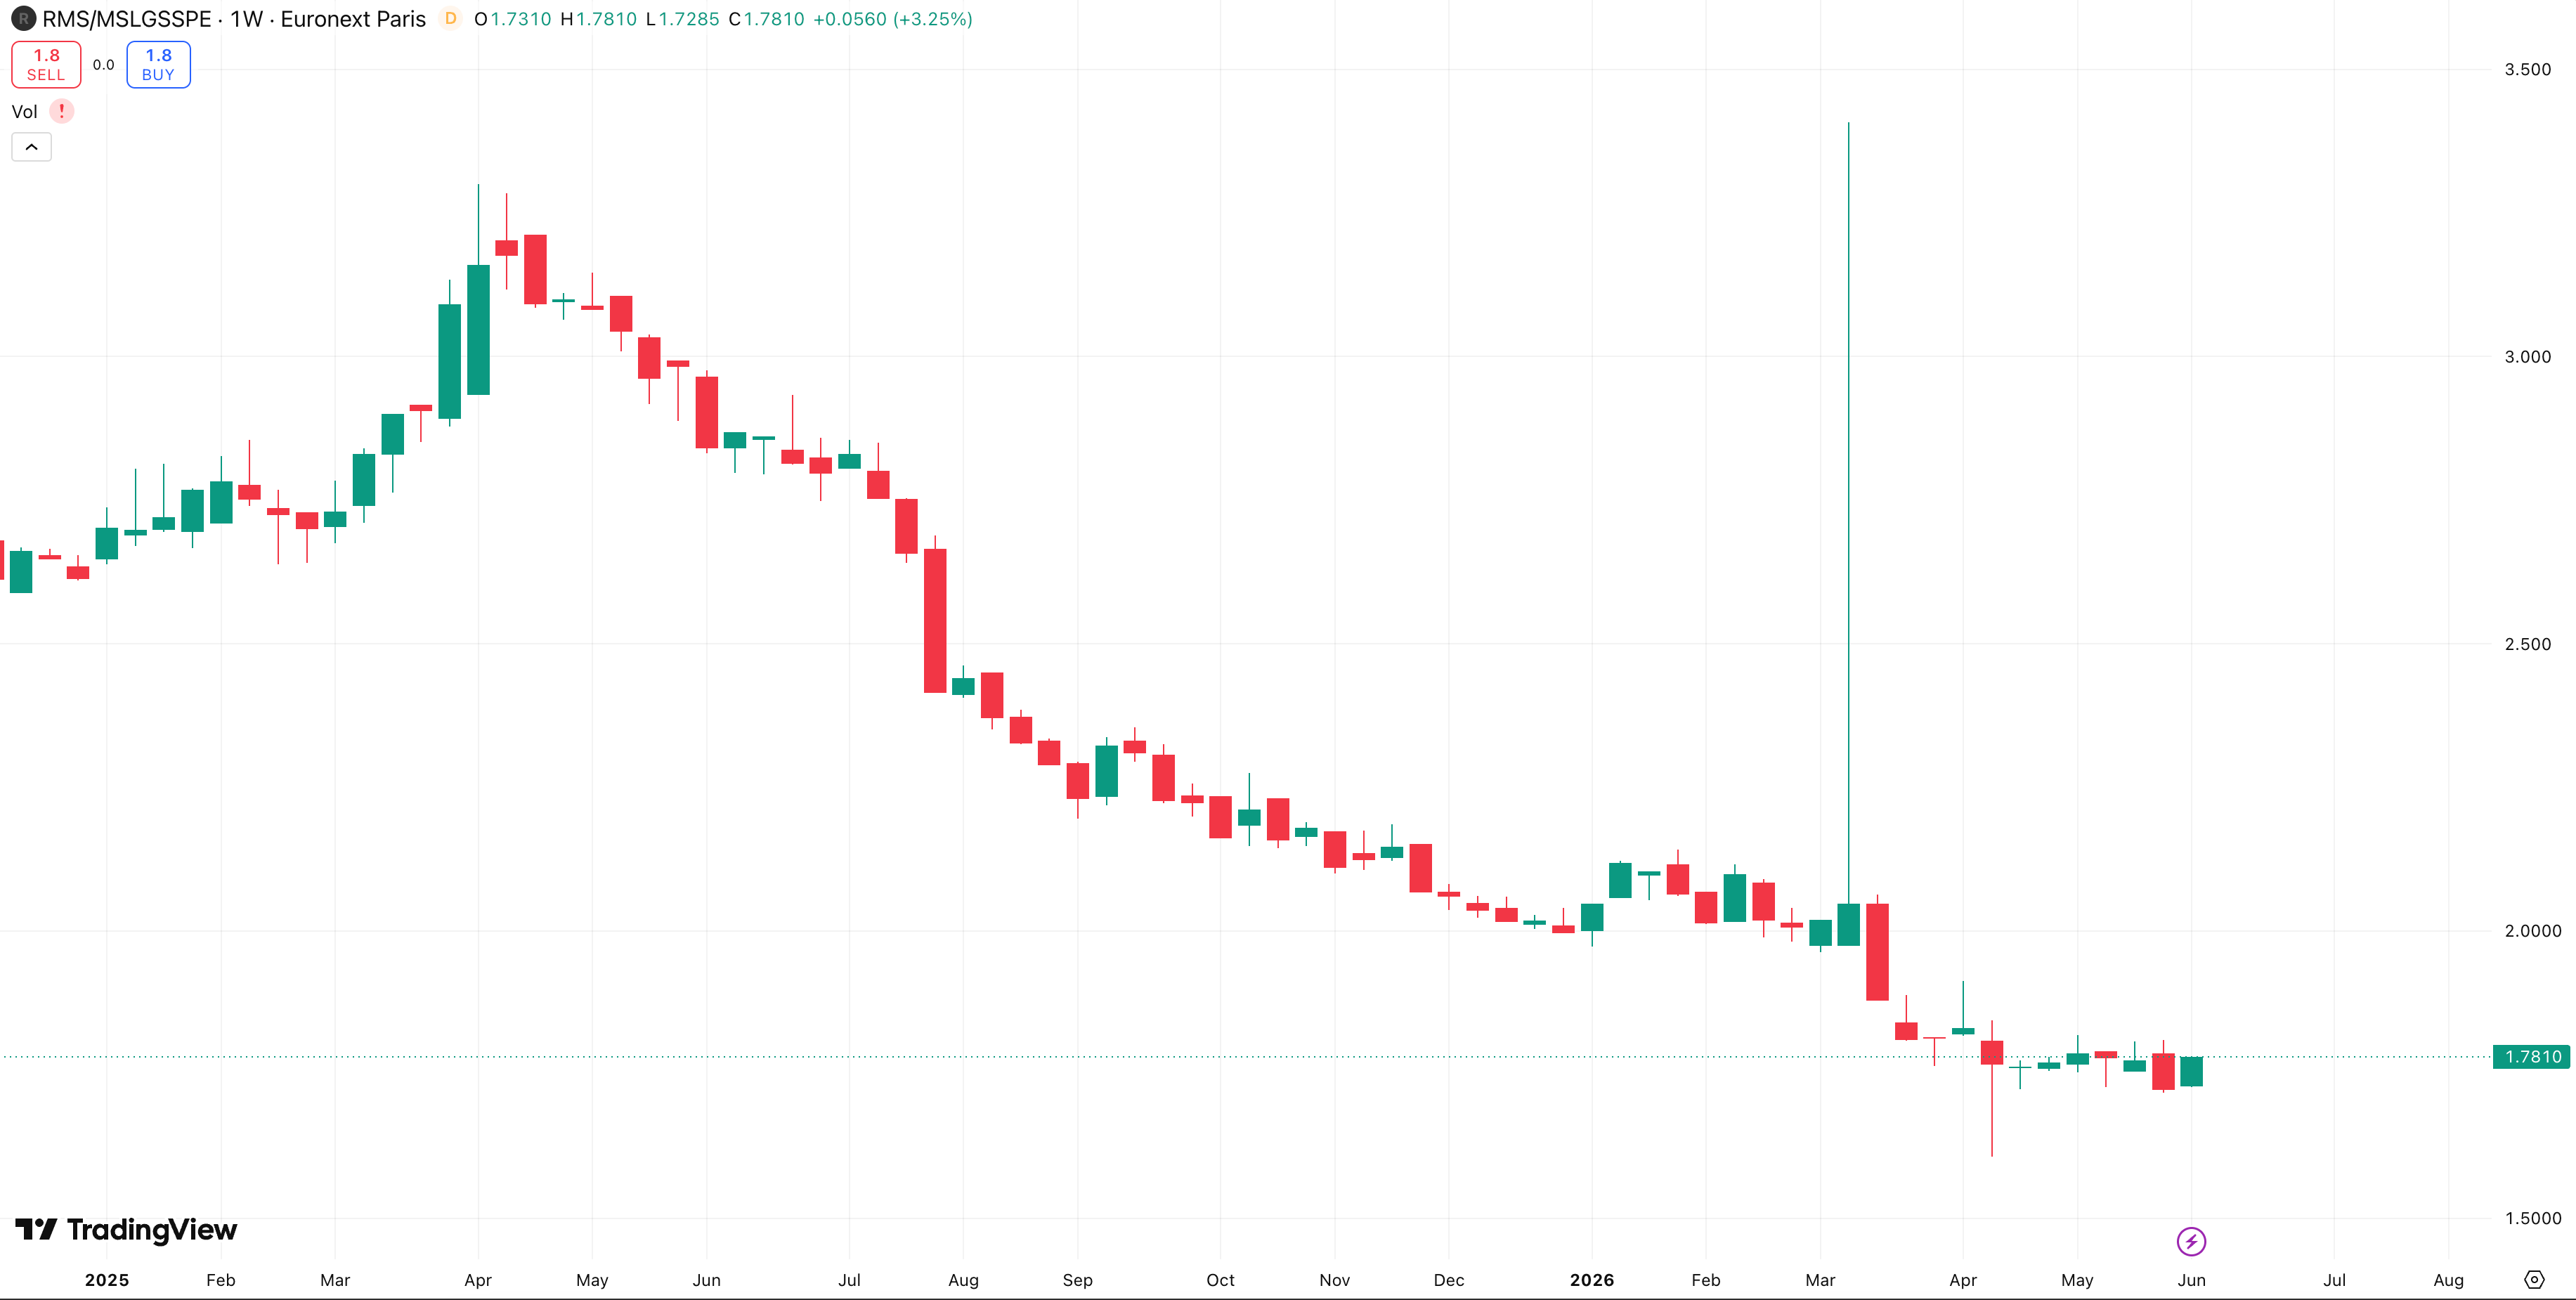
Reading the Hermès Tea Leaves, in Real Time
It’s clear that Hermès clears the fundamental bar with room to spare. It is one of the highest-quality compounders in the world, with pricing power that survives recessions, family control, and a runway measured in decades.
So the only open question is when should an investor buy, and that’s where the technicals help.
At time of writing (early June 2026) the share price of €1,619 sits roughly 18% below a 200-day average (blue line). The 50-day moving average (red line) crossed below the 200-day months ago and hasn’t looked back - a death cross still in force.
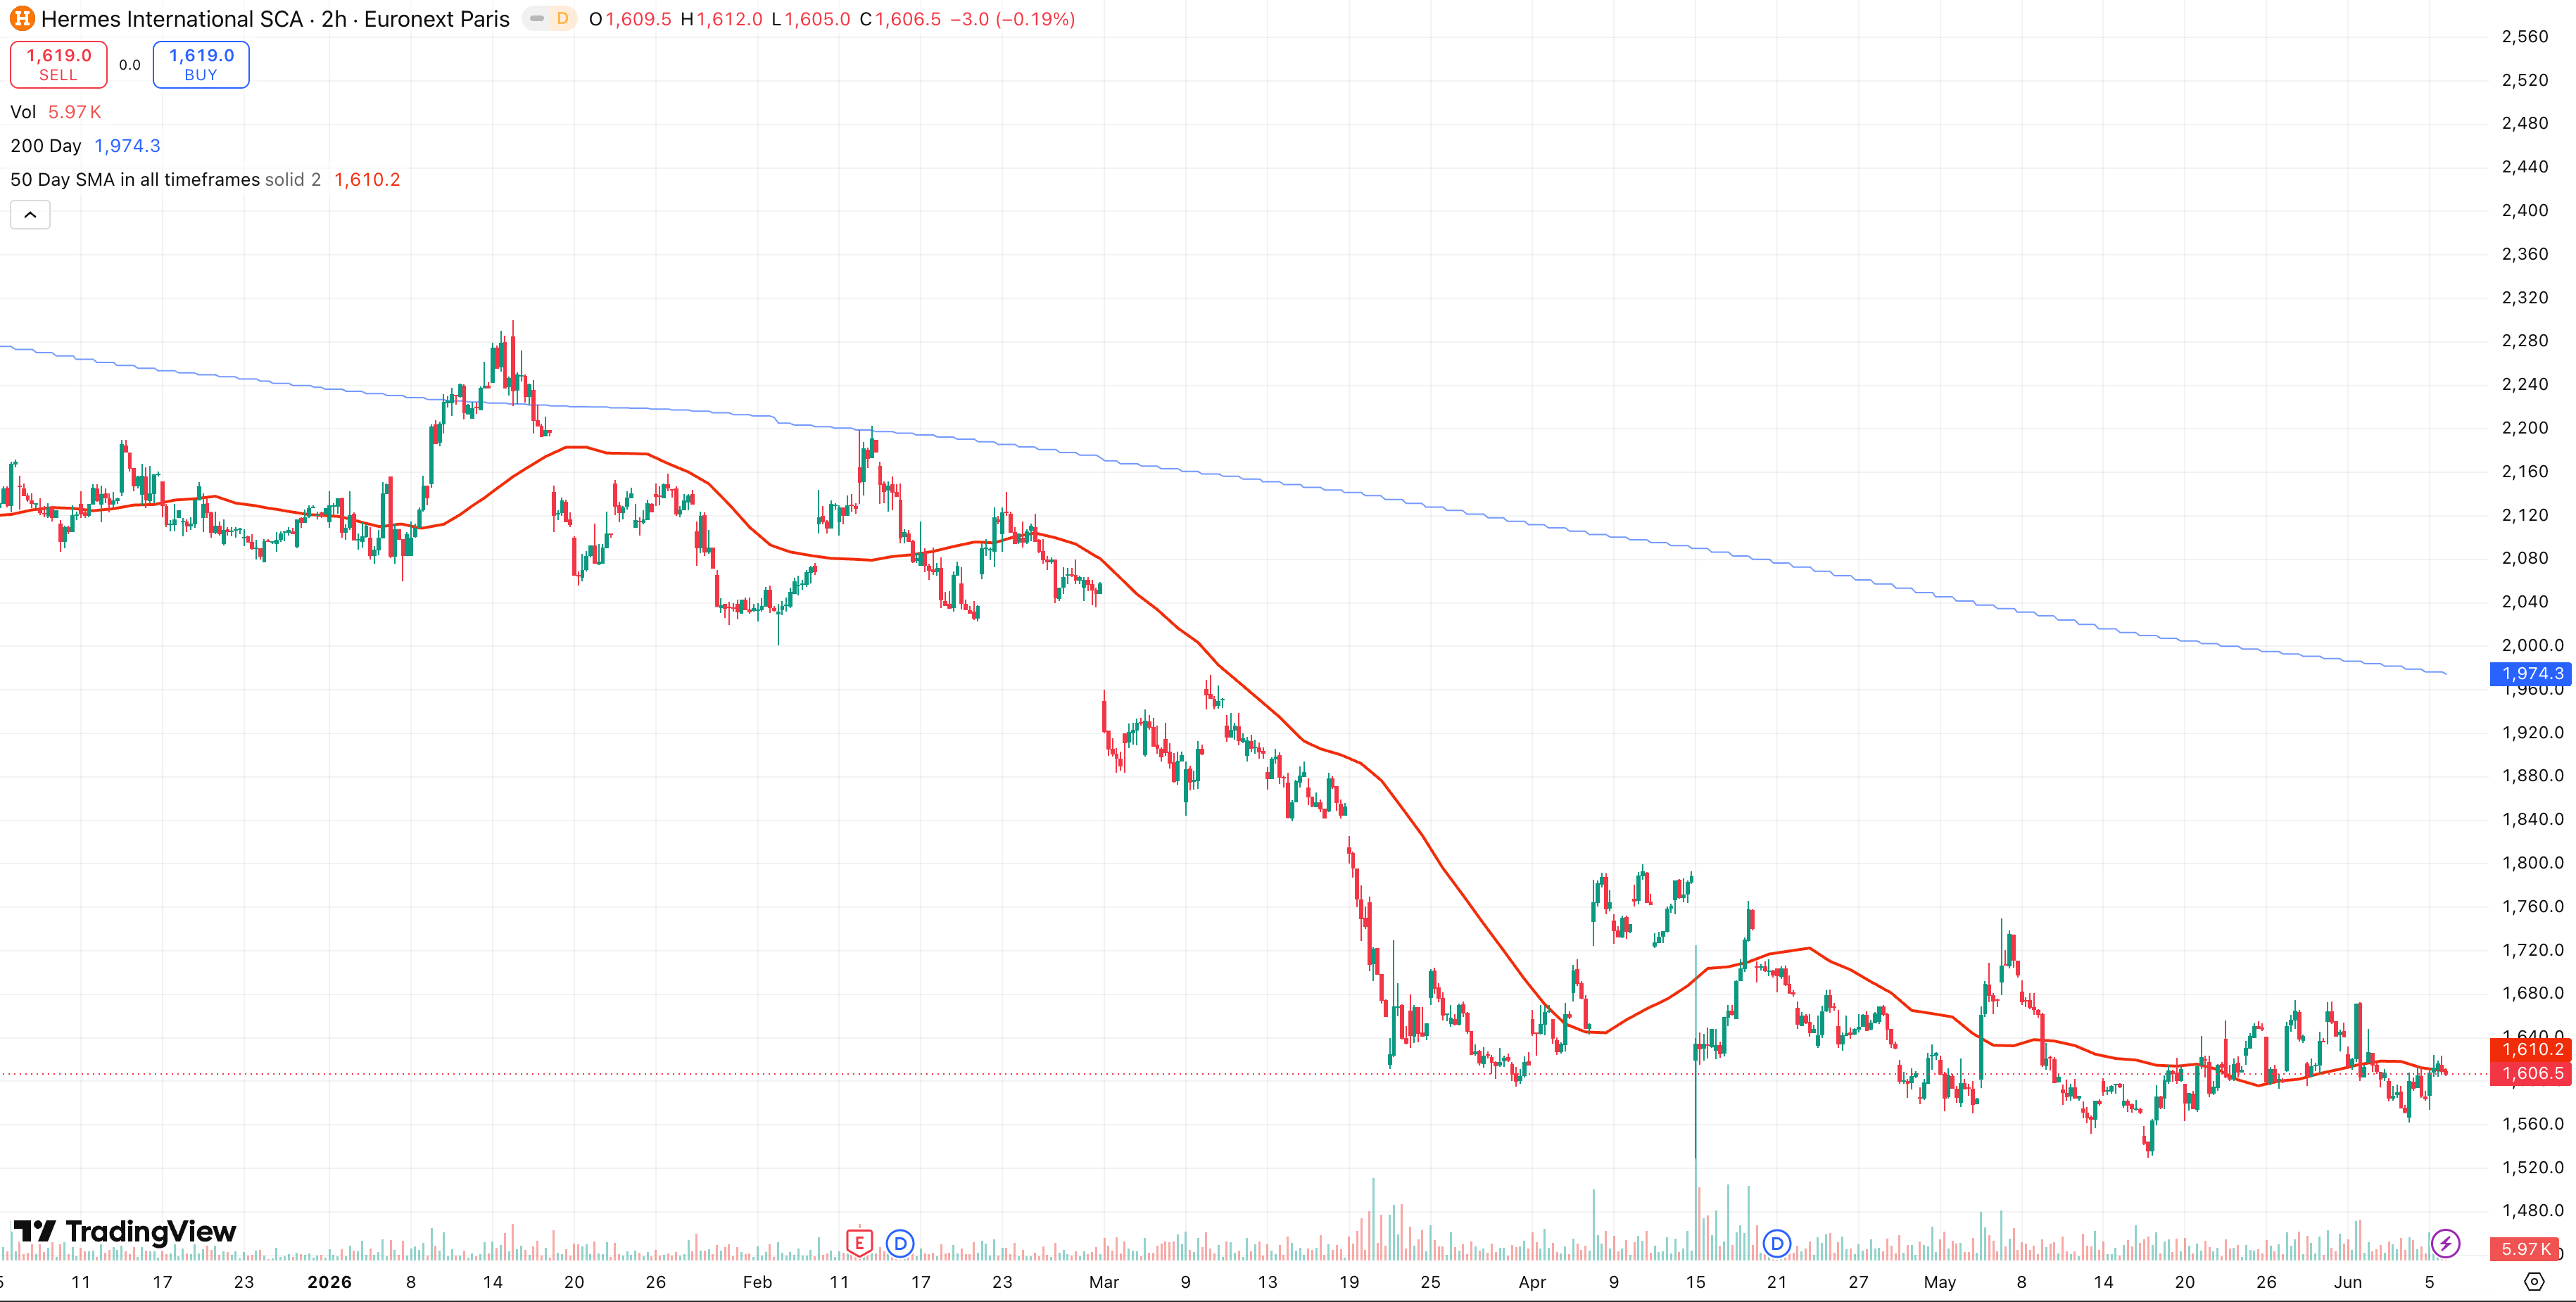
As of late, the price has begun to tick above the 50-day moving average, so the downward pressure is abating, although the upward pressure has not arrived.
Relative strength is where it gets interesting. The question here isn’t whether Hermès is down, but whether it’s down worse than the comparator. We can choose the comparator - SPY, SXXP, or the Morningstar Global Luxury Index, which is shown below.
When we plot the the ratio of the share price to the Morningstar Global Luxury Index, we see a downward trend which tells us that Hermès has been selling off worse than its luxury peers. We see this started in April 2025, and appears to have bottomed as of late.
Historically, Hermès falls less than its peers in a sector drawdown, and currently we are seeing the opposite. The malignant reading is that the market thinks Hermès’ business is broken; the benign reading is that others have started to recover, while Hermès has not.
The chart provides the information, and then it’s up to the fundamental analysis to come to a conclusion if this is signal, or noise. For those who believe the business is not broken and want to start a position, what does the framework instruct?
A small starter position is easily defensible; you are, after all, being handed a generational franchise at multi-year lows. But the momentum has been downwards and big buyers are waiting for the price action to turn.
The technicals would say that the time to start buying is when price stays above the 50-day average, with the 200-day flattening and then starting to trend up. A golden cross (50-day average crossing 200-day average) would confirm the positive momentum, and it would be a clear sign that the crowd has finished selling.
Relative strength against the luxury basket would also start to lead, rather than lag.
When Intrinsic Value and Momentum Conflict
When intrinsic value and momentum disagree on the buy side, resist the urge to treat it as a contradiction that has to be resolved before you act. The mistake is to let the technicals veto the fundamentals, or to let the fundamentals blind you to the technicals. Two things can be true - shares can be below its intrinsic value and have negative momentum.
In this situation then, the approach is in position sizing.
If fundamentals say yes and technicals say no, consider taking a smaller, starter tranche. This puts capital to work at a price you may not see again, and it guarantees you own the business if the technical turn comes without warning.
The rest of the position is the price of admission you pay to the trend - you’d choose to ignore the technicals and add into negative momentum, or you’d hold off and add as the momentum turns positive.
Yes, by the time those confirmations arrive you will be paying €1,800 or €1,900 for shares you could have bought at €1,600. That is not necessarily a failure though, it’s the tradeoff you’d be making to avoid averaging into a falling knife that keeps falling.
Ultimately, this is a judgement tool, that you can choose to use or not use.
An investor with genuine conviction, a long enough horizon, and the stomach to sit through further drawdown can legitimately weight the intrinsic-value signal more heavily and front-load the position. The technical analysis tools are not specifically a reason to refuse a price you’ve already judged to be cheap.
Ok, What About Holding, or Selling?
The crux of compound interest rests on holding great businesses for long periods of time. When you’re already in a position and have no intention of buying, then technical analysis has no role.
If the fundamental work says the thesis is intact, then the chart changes nothing and you hold; if the fundamental work says the thesis is broken, then it doesn’t matter what the chart says.
We advise only using technical analysis tools for trying to time entries based on momentum, not for monitoring positions, and not for trying to time sells.

The Verdict
Let’s circle back to the start. You’re holding Hermès, watching it fall for months, not knowing whether the market sees something you don't. Nothing in these three papers changes the fundamentals of the business.
What changes is the story you tell yourself about the falling price. It is not necessarily a verdict on the fundamentals, and it is not necessarily noise either.
It is the crowd, voting in aggregate, in a language that the fundamentals don’t speak. These fundamentals signal the worth of the business, while the technicals signal the movements of the crowd.
The fundamental investor who sneers at the technical signals always risks catching a falling knife. If investor chooses that it doesn’t matter, then technical analysis has no role. For those fundamental investors who wish to limit drawdowns, then technical analysis has a role in timing buys.
You are free to ignore it, and plenty of great investors do, and sit through the drawdown by choice.
But that should be a choice, not a blind spot.
Enjoy the article?
Do us a favor and share it with your network.
Want to learn more?
Continue the pursuit and check out our library of all posts below 📚
