
Beyond ROIC: Measuring the Returns on New Capital
Measuring Meta’s Returns: Mauboussin vs. Huber


This post was written in collaboration with Masters of Compounding, whose work I strongly encourage you to follow.
Our favourite articles are found here, here, and here. There is an extensive library to dive into - and it’s free!
Every investor loves a great compounder: a business that can turn 1$ into 1.30$ year after year.
Look closely and you’ll almost always find a high ROIC (Return on Invested Capital) behind it.
But as investors, what we really care about are two things:
whether today’s great compounders will stay that way, and
which companies are on their way to becoming the next ones.
For that purpose, ROIC alone doesn’t help much.
Fortunately, there’s a ROIC-derived metric that’s much better suited to understanding the present and anticipating the future: ROIIC (Return on Incremental Invested Capital).
In this piece, we compare ROIC and ROIIC, and show how to use them in practice to judge the quality of a business.
ROIC
Definition
ROIC measures the return a company generates on the capital actually deployed to run and grow the business:
The numerator is NOPAT (Net Operating Profit After Tax):
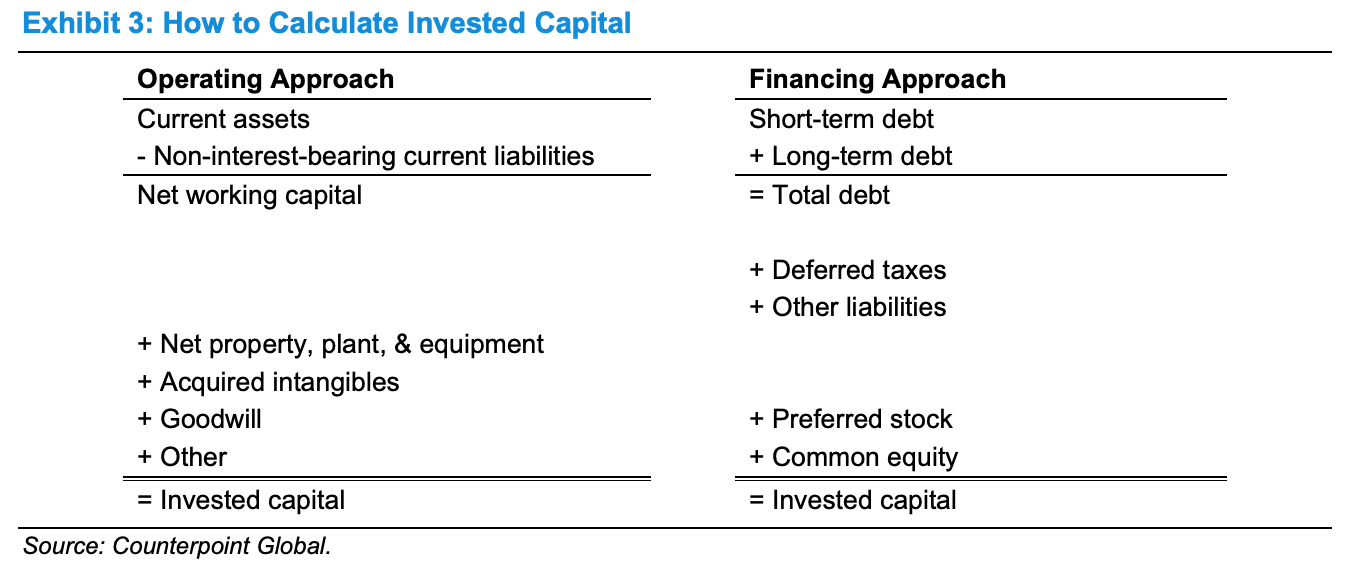
The denominator is Invested Capital, which represents the capital employed in the company’s core operating activities:
Invested Capital = Networking Capital
(+) PP&E
(+) Other Operating Assets
(-) Other Operating Liabilities
Advantages
ROIC is one of the most widely used performance metrics, and for good reason:
1. Strong Indicator of Operating Quality
In the brutal world of creative destruction, sustaining high returns on invested capital over time is almost always a signal that something special is going on:
disciplined capital allocation,
a durable moat,
pricing power,
etc.
Consistently high ROIC is rarely an accident.
2. Direct Link to Value Creation
ROIC allows you to quickly assess whether a company has created value or destroyed it over its life:
If ROIC > opportunity cost of capital (or WACC [Weighted Average Cost of Capital], for the purists), the company is creating value.
If ROIC < opportunity cost of capital, it’s destroying value.
The comparison is conceptually simple and very powerful—on paper.
In practice, estimating the true opportunity cost of capital is hard for investors, which is why most people fall back on using an estimate of the WACC instead.
3. Easy Comparability Across Companies
Outside of a few specific sectors (banks, for instance, where ROE is usually more relevant), ROIC is broadly comparable:
across sizes (small vs large caps),
across industries,
across business models.
This makes it a useful metric to rank and filter businesses on economic quality.
Here’s the distribution of ROIC by industry:

4. Aligned With Long-Term Investing Logic
Over the long run, one of the main drivers of shareholder value creation is a company’s ability to reinvest at high ROIC for many years. ROIC is essentially a snapshot, at a given point in time, of how effectively the company has deployed capital over its life so far.
The higher and more durable the ROIC, the more powerful the compounding engine for a long-term investor.
Drawbacks and Limits
A simple metric almost always comes with important limits. And ROIC is no exception.
1. Significant Sensitivity to Accounting Conventions
Here, both the numerator and the denominator are called into question.
Operating income depends on accounting standards related to:
revenue recognition (subscriptions vs one-shot sales, cut-off, etc.);
the treatment of certain expenses (capitalization vs immediate expensing);
the categorization of exceptional or non-recurring items (restructurings, impairments, gains/losses on asset disposals, etc.).
It’s even trickier for invested capital:
whether R&D expenses are capitalized or expensed;
goodwill and intangible assets (especially for companies that do a lot of M&A and see their ROIC go down after each acquisition, even if their organic business hasn’t necessarily changed);
how items are classified as operating vs non-operating, which changes what is included in “invested capital”.
Changes in accounting rules can also distort reported ROIC. The most relevant recent example is IFRS 16 on lease accounting, which artificially pushed assets up, and therefore invested capital.
That said, this sensitivity to accounting conventions is shared by almost all metrics. It is a drawback, yes, but a nearly ubiquitous one.
2. It Can Distort the True Performance of Companies with an Asset-Light Model
In asset-light models, invested capital is structurally low. With a smaller denominator, ROIC is mechanically higher.
But this does not necessarily reflect the company’s ability to reinvest at such returns in a sustainable way.
It’s quite common to see asset-heavy businesses become more asset-light in times of crisis (reduction of spending, closure of unprofitable stores, etc.), and ROIC tends to increase sharply.
In such cases, the business may be in distress, but the changes in ROIC tend to suggest that the business is improving.
3. It Mixes the Recent Past and the Distant Past
ROIC weights all historical capital similarly. A recent bad (good) capital allocation decision can be completely drowned out by many years of good (bad) capital allocation.
This becomes a major issue when a company is changing or developing a new business model, or going through a deep management transition.
It can take years before ROIC really reflects the impact of those more recent good or bad decisions.
Conversely, a young company can show ROIC figures that are totally out of proportion with its likely future economics, especially if it does a lot of M&A.
Yet for an investor, what matters is the present and the range of futures that can emerge from it.
And that’s exactly what ROIIC is designed to capture.
ROIIC
Definition
ROIIC (Return on Incremental Invested Capital) is the same concept as ROIC, but it focuses specifically on the change in invested capital and NOPAT over a defined period.
In other words, ROIIC measures how much additional NOPAT a company generates from the incremental invested capital over a given period (a quarter, a year, etc).
Advantages
The power of ROIIC comes from the fact that you can choose the analysis period.
By adjusting the time window, you can:
break a company’s history into coherent blocks (reflecting specific capital allocation phases), and
measure, for each of them, the incremental returns generated by the new capital committed during that period.
As a result, instead of a single average return reflecting the company’s entire history, as with ROIC, ROIIC allows you to isolate exactly what you want to study:
before / after a business model change
before / after a major investment cycle
before / after the arrival of new management, etc.
In general, the best predictor of the near future is the recent past. This ability to zoom in on the recent past is precisely what makes ROIIC so powerful.
In the current context of the AI revolution, this is particularly useful. Many companies are shifting toward massive AI-related CapEx, without it yet being clear whether these bets are rational or not.
By adjusting the period, you can:
look at “pre-AI” ROIIC,
then at ROIIC during the years when AI CapEx accelerates,
and compare the quality of the dollars invested before and after this strategic shift.
This is exactly what we will do later with Meta: use ROIC and ROIIC to assess the true economic value of its AI investments.
However, here too, new advantages come with new drawbacks.
Drawbacks and Limits
The ability of ROIIC to focus on specific periods simply amplifies all the weaknesses already present in ROIC.
With ROIC, any impact on NOPAT or invested capital is diluted within a large set of data.
Here, we use a smaller slice of that data. The impacts themselves, however, do not necessarily shrink. As a result, their impact on the math becomes much larger. Here’s an example.
For ROIC:
Total invested capital for ROIC = 100M
NOPAT = 30M
ROIC = 30 / 100 = 30%
For ROIIC:
Incremental invested capital for ROIIC = 10M
Incremental NOPAT = 3M
ROIIC = 3 / 10 = 30%
Now assume a change in accounting standards that requires recognizing an additional 10M of invested capital (including over the period used to compute ROIIC).
New ROIC:
Total invested capital = 110M
NOPAT = 30M
ROIC = 30 / 110 = 27.2%
New ROIIC:
Incremental invested capital = 20M
Incremental NOPAT = 3M
ROIIC = 3 / 20 = 15%
We can clearly see that ROIIC is artificially depressed due to a purely accounting change.
If one still wants to use ROIIC under these conditions, one must make judgment calls with the objective of staying as close as possible to the company’s underlying economic reality.
And this brings us to the main “flaw” of ROIIC: it does not solve the problems of ROIC, it merely transfers them. More precisely, ROIIC fixes the “average vs incremental” issue, but at the cost of worsening the “accounting vs economic” issue.
It is therefore a tool with very little room for error, requiring a deep understanding of the situation, as well as of where and when to apply it, in order to produce results that are both meaningful and interpretable.
With this framework in place, let’s move on to practice with Meta.
ROIC/ROIIC Framework Applied to Meta
A hot topic among investors in recent years has been the return on AI investments at the hyper-scalers in the S&P 500. Not only have AI investments been growing at a rapid clip, but they are expected to continue to grow into 2027.
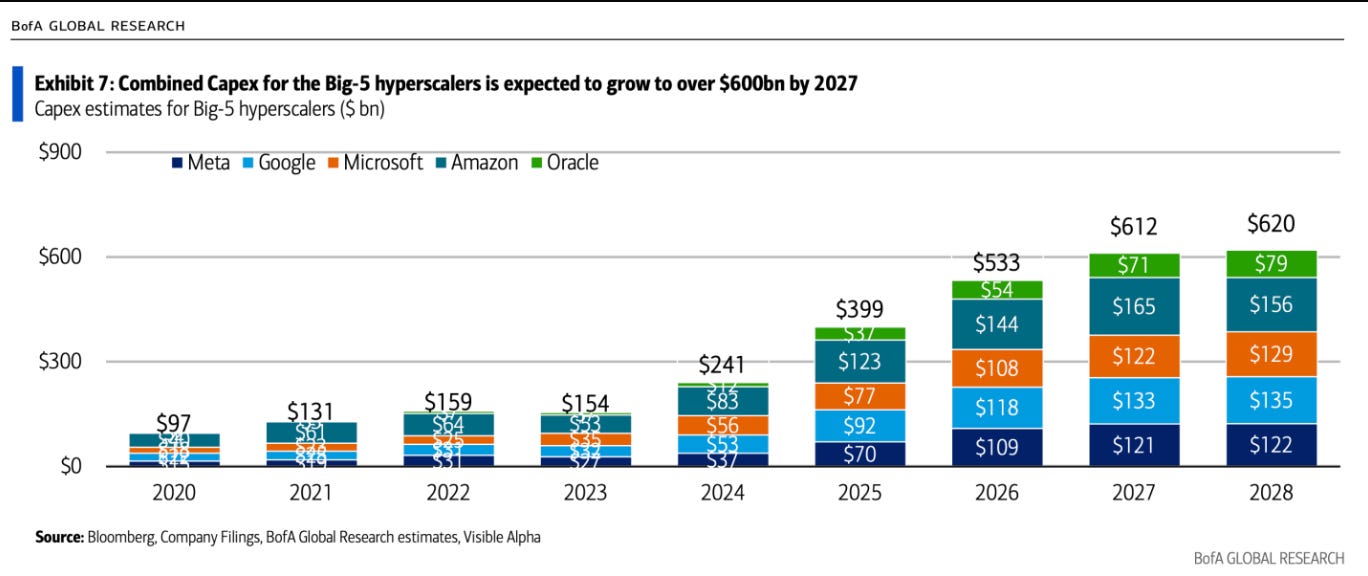
In October 2025, Meta reported record Q3 results, beating both top and bottom line estimates, and yet the shares sold off nearly 10%. The company also raised its 2025 guidance for capital expenditures, which will now come in the range of $70 billion to $72 billion, where the prior outlook was between the range of $66 to $72 billion.
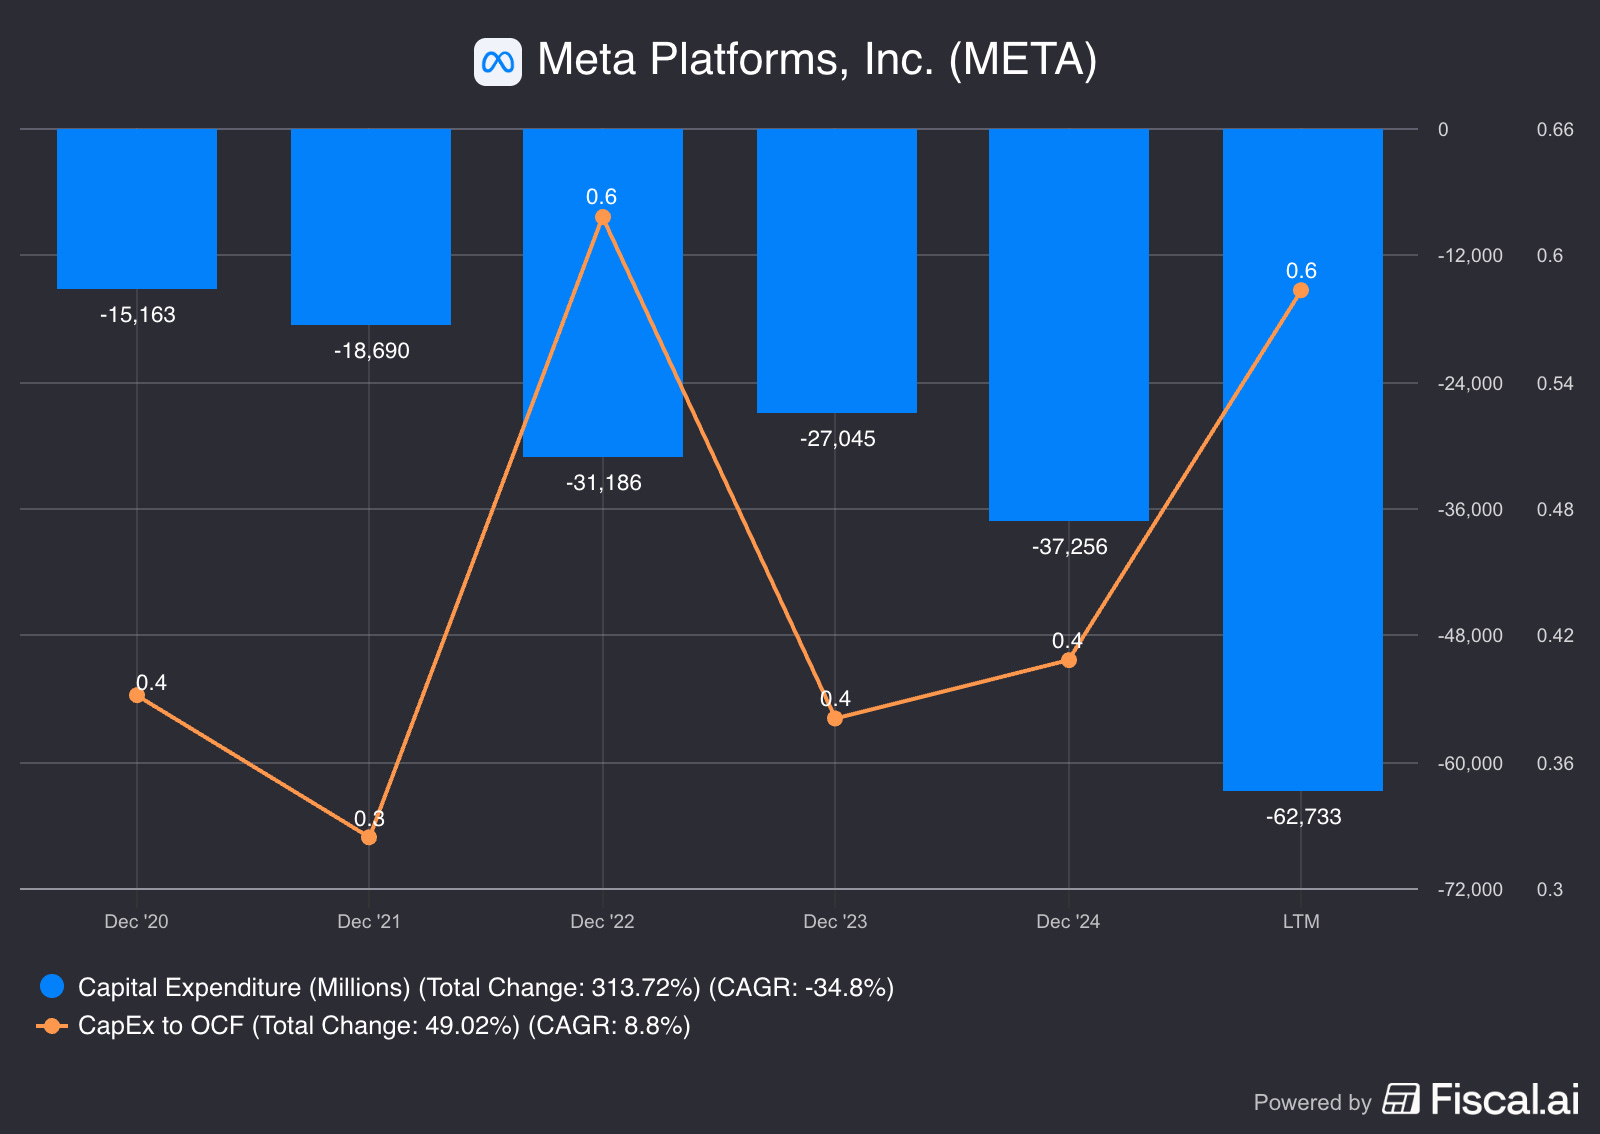
Over the past five years, Meta’s CapEx has already grown at nearly 35% annualized, while becoming an increasingly larger part of its Operating Cash Flow.
“…being able to make a significantly larger investment here is very likely to be a profitable thing over, over some period,”
Mark Zuckerberg - Founder, Chairman & CEO of Meta - Q3 2025 Conference Call
Is Zuck lighting money on fire? Is this yet another example of the AI bubble? Or is Meta laying the groundwork for future growth?
For this case study, we will apply the “Operating Approach” framework of Michael Mauboussin to calculate ROIC and ROIIC, using Net Operating Profit After Tax (NOPAT).
Michael Mauboussin’s framework focuses on isolating the operating performance of the firm from its financing decisions and non-operating assets. This provides a clear view of the “cash-on-cash” return of the business operations.
Further, we’ll examine it against the approach of John Huber, who uses Net Income instead of NOPAT, with different adjustments to the Invested Capital Base. The overarching goal is to assess Meta’s return on its AI investments from 2020 to 2024.
Capital Light to Capital Intensive
Meta entered 2020 as a highly efficient, asset-light social media (software) utility benefiting from a pandemic-induced digital advertising boom.
By 2022, it faced an existential crisis of capital efficiency, characterized by rising expenses, a degraded advertising signal due to Apple’s iOS privacy changes, and a skeptical market reaction to its massive Reality Labs investments.
“We continue to see a lot of opportunity across our investment priorities and remain committed to dedicating additional talent and capital toward these areas while ensuring our investment plans are appropriately calibrated to the operating environment”
Mark Zuckerberg - Founder, Chairman & CEO of Meta - Q1 2022 Conference Call
However, the subsequent fiscal years of 2023 and 2024 demonstrate a profound turnaround — stemming from the “Year of Efficiency” — that morphed into an AI-driven renaissance.
We will show that this has validated the heavy capital deployments of the prior cycle, evolving Meta into a hardware-intensive digital utility.
Return on Invested Capital Calculation for Meta
NOPAT Calculation for Meta
Meta has both tangible (hardware) and intangible (code, intellectual property) assets. We need to properly account for this in the NOPAT calculation. As Mauboussin states:
“We want to put all companies on the same footing in order to measure ROIC consistently. The way to do that is to put intangible assets on the balance sheet and amortize them over their useful lives. We will call the line item “capitalized intangibles, net.” This way we treat all investments alike.”
Thus, in doing the NOPAT calculation, we will make a reasonable attempt to estimate the amortization of the intangibles.
Table 1: NOPAT Calculation for Meta from 2020 to 2024
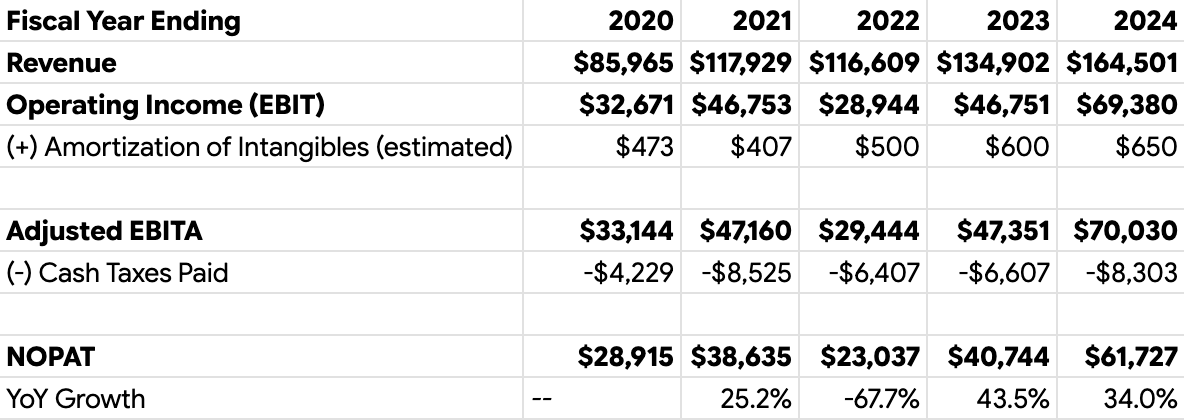
Between 2020 and 2024 Meta experienced substantial volatility in its NOPAT. The jump in 2021 reflects the pandemic pull-forward. The collapse in 2022 (-39.9%) was driven by a perfect storm:
the revenue decline (weaker demand for ads),
combined with a massive OpEx ramp (headcount added in anticipation of growth that didn’t materialize),
Is it any surprise Meta shares were down ~75% in 2022?
The NOPAT recovery in 2023 and 2024 was equally dramatic, driven by the “Year of Efficiency” cost cuts, as well as the accelerating monetization of Reels and Advantage + AI tools.
Invested Capital Calculation for Meta
The Invested Capital base expanded from $79.5 billion in 2020 to $163.8 billion in 2024, even after stripping out the non-operating assets and adding back PP&E, Operating Leases, Goodwill, and Intangibles.
Table 2: Invested Capital Calculation for Meta from 2020 to 2024
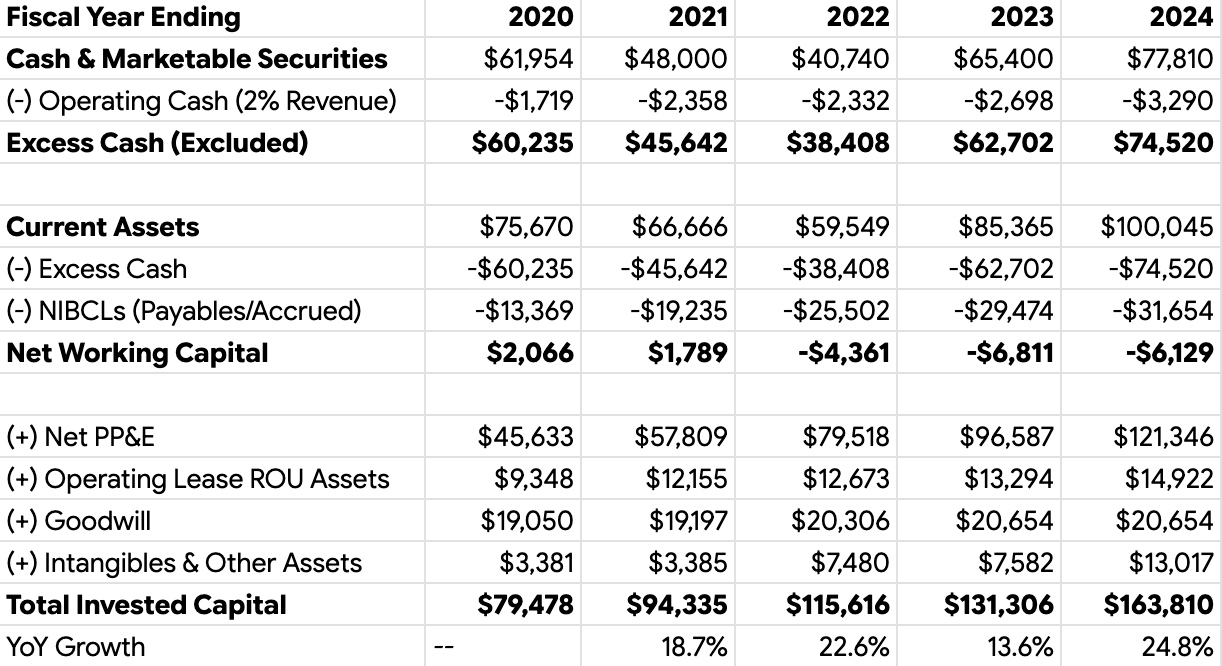
The defining feature of this table is the explosion in Net PP&E, which nearly tripled from $45.6 billion in 2020 to $121.3 billion in 2024. This represents the physical manifestation of Meta’s strategy: data centers, servers, and network infrastructure.
Note also the shift in Net Working Capital to a negative figure from 2022 onwards. Meta is employing a Negative Net Working Capital strategy, financing its operations using its suppliers’ balance sheets (Accounts Payable), all while collecting cash from advertisers relatively quickly.
This negative working capital acts as a source of funds, partially offsetting the massive PP&E spend.
We can now calculate Meta’s ROIC.
ROIC Calculation for Meta
Table 3: ROIC Calculation for Meta
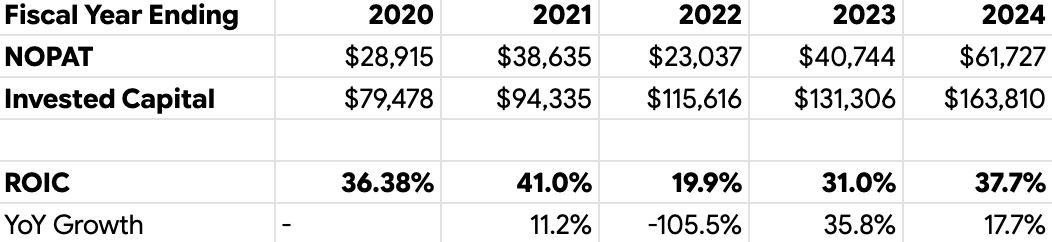
Despite this doubling of the capital base, the Return on Invested Capital (ROIC) has demonstrated remarkable resilience, rebounding from a nadir of 19.9% in 2022 to 37.7% in 2024.
This suggests that the “denominator problem” — the rapid expansion of the asset base — has been matched by an equally potent expansion in the numerator (NOPAT), driven by AI-enhanced monetization:
“advertisers are increasingly just going to be able to give us a business objective and give us a credit card or bank account and like have the AI system basically figure out everything else that’s necessary including generating video or different types of creative that might resonate with different people that are personalized in different ways, finding who the right customers are.” Mark Zuckerberg - Founder, Chairman & CEO of Meta - Q3 2025 Conference Call
This ROIC analysis provides quantitative evidence that the aggressive capital deployment of 2022, which was heavily criticized at the time, was not value-destructive. Instead, it led to the explosive NOPAT growth seen in 2023 and 2024.
We can see that the investments made in GPU clusters and data center re-architecture sowed the seeds for resurgence in 2023 and 2024. The GPU clusters bought in 2022 began powering the discovery engine, increasing time spent on Reels, which in turn attracted ad dollars.
This also contradicts the narrative that capital intensity inevitably degrades ROIC. Based on this analysis, the lag time for AI infrastructure CapEx to start generating returns appears to be approximately 18 to 24 months.
The recent past looks great for Meta! What do the incremental returns look like? Is Meta maintaining its status as a great compounder?
ROIIC Calculation for Meta
Let’s go one step further and calculate the ROIIC according to Mauboussin’s framework.
Table 4: ROIIC Calculation for Meta.
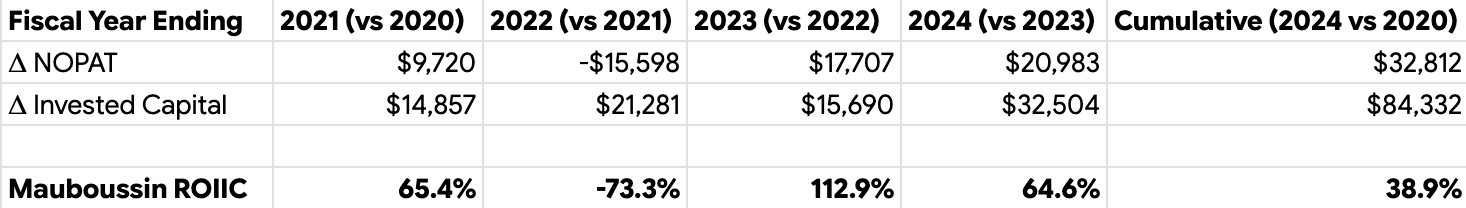
The -73.3% ROIIC in 2022 is an example of the J-Curve that can occur in capital investments. Meta deployed $21.2 billion in incremental capital, yet its NOPAT dropped by 68%. In a vacuum, this looks like value destruction.
However, in the context of Meta, it represents the lag from when the capital investments occur, versus when they begin to generate NOPAT. Data centers built in 2022 do not come online instantly; GPU clusters require configuration and software optimization before they can drive ad ranking improvements.
Over the entire period (2020-2024) Meta, however, generated nearly $33 billion in new cash profit on $84 billion of invested capital, at an ROIIC of nearly 39%.
This implies that the internal rate of return (IRR) on Meta’s AI infrastructure is exceptionally high. This “ever-escalating spend” is not vanishing into a black hole where capital never returns — it is being converted into NOPAT at a rate of 39 cents on the dollar annually.
Huber vs. Mauboussin
John Huber’s framework provides a different lens. He instead looks at Net Income (which includes interest income) and Tangible Capital (excluding Goodwill and Intangibles), to assess the compounded return.
By stripping these out, he instead focuses on the financial asset return (including interest income from Meta’s massive cash pile). Huber assesses the value creation from all tangible parts of the business, not just from the underlying operations.
Table 5: Tangible Capital Calculation for Meta
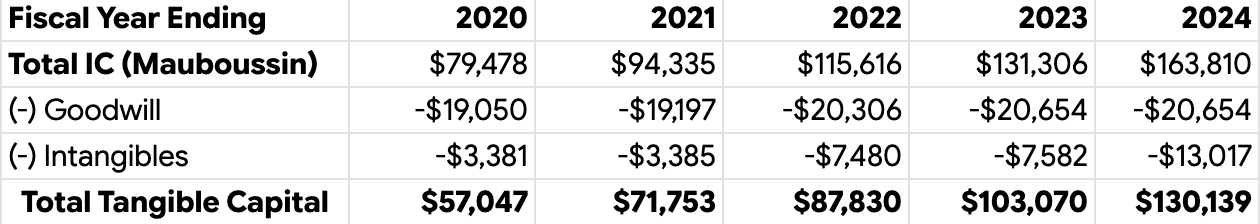
Huber’s ROIIC metric suggests Meta is compounding at rates exceeding 45% on incremental invested tangible capital, contrasted to Mauboussin’s 39% on incremental invested capital.
Figure 1: Calculated ROIIC for Meta using both Mauboussin and Huber methodology
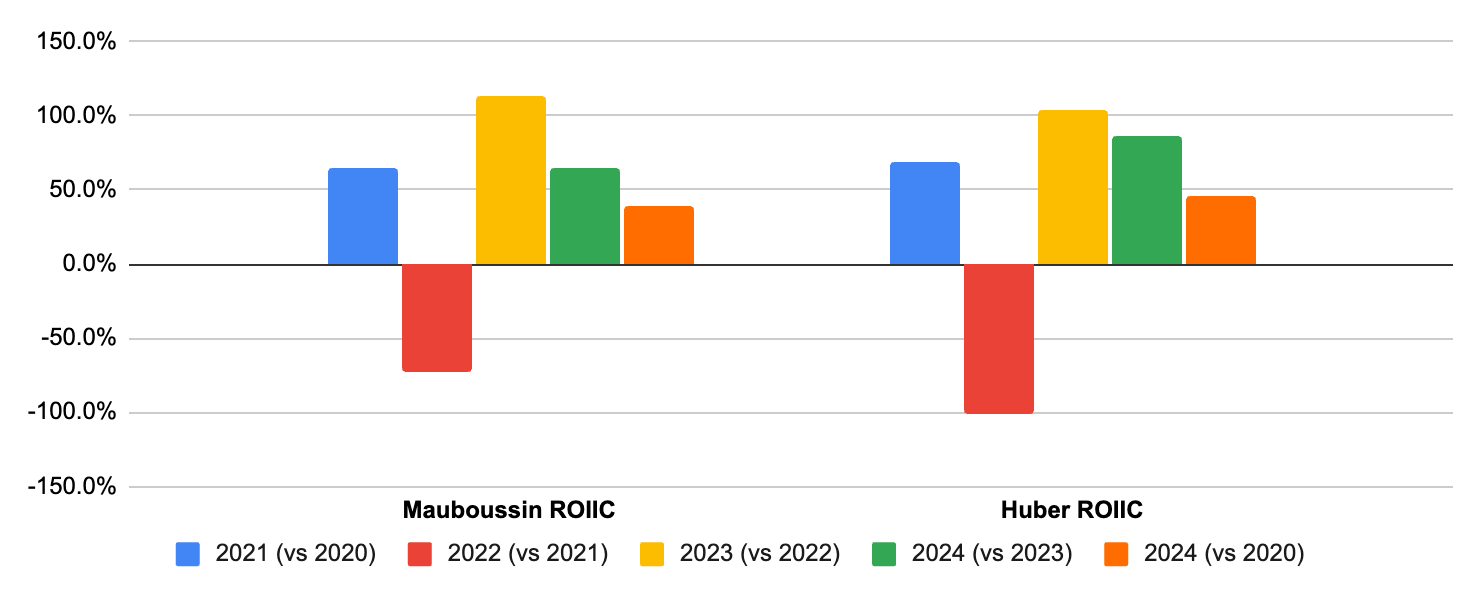
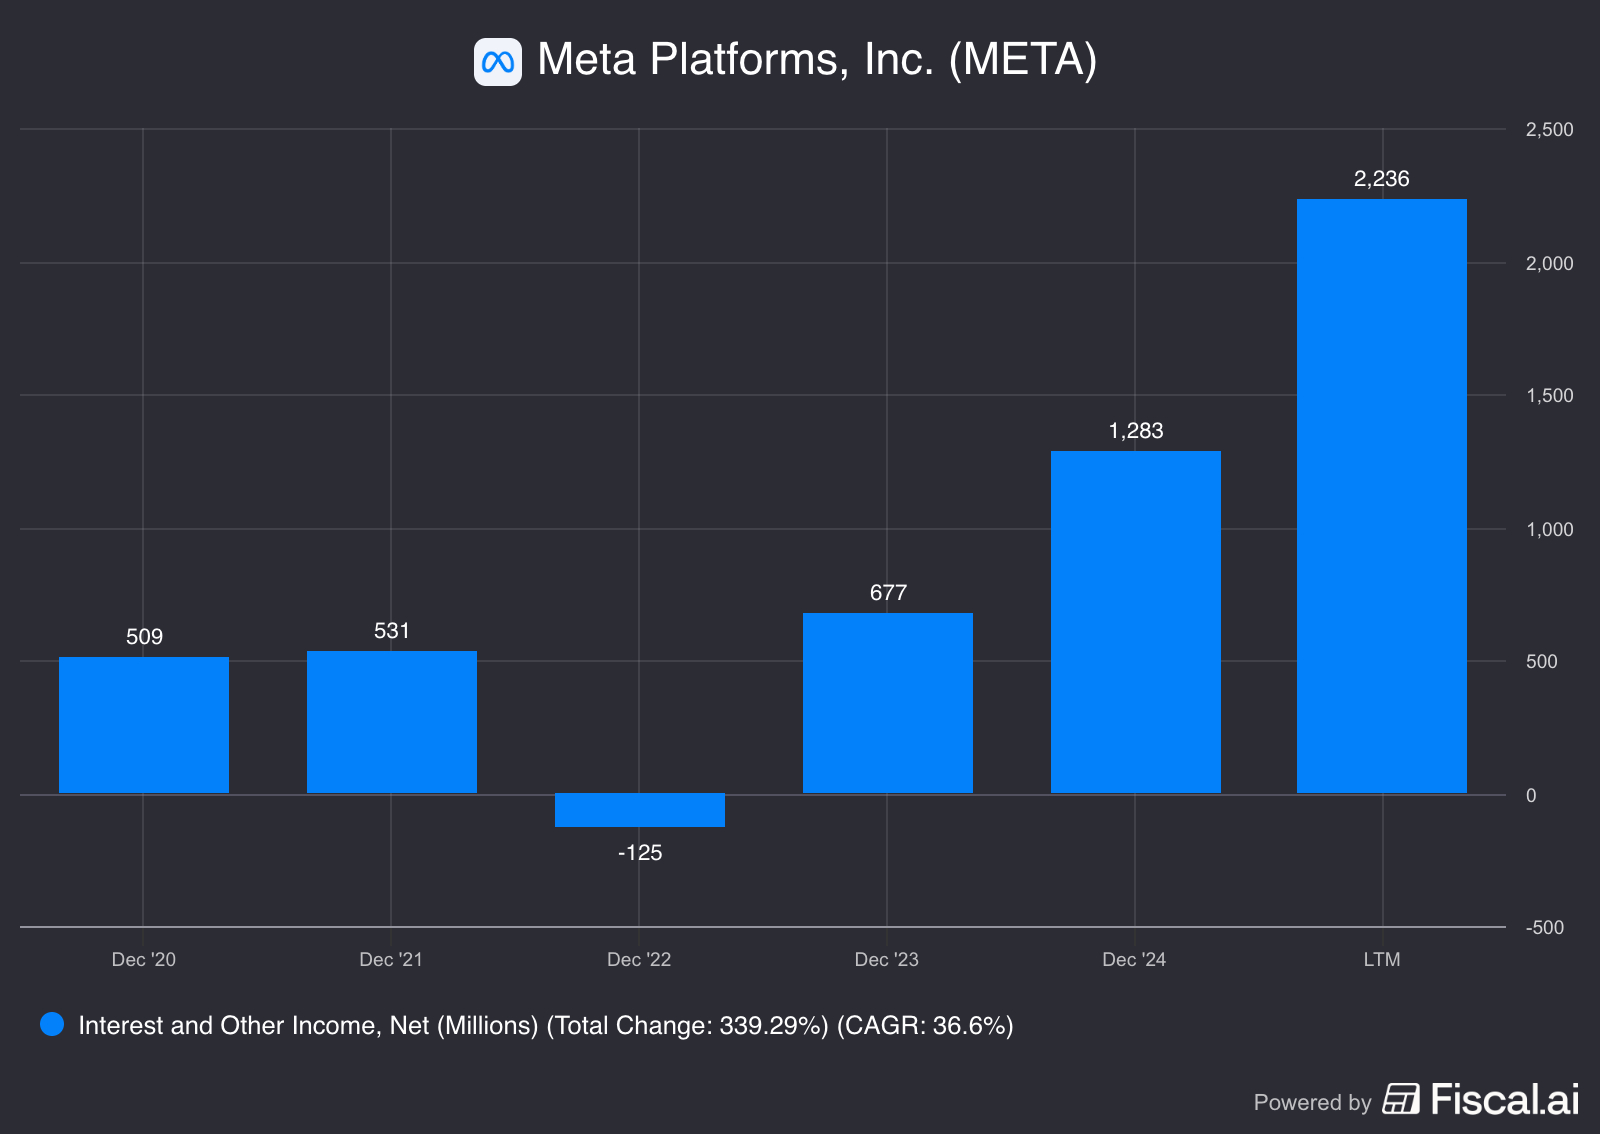
Huber’s use of Net Income captures the benefit of Meta’s fortress balance sheet. In 2023 and 2024, interest rates surged. Meta, holding roughly $70+ billion in cash and marketable securities, generated substantial Interest Income.
Mauboussin’s NOPAT excludes this to focus on operating purity. Huber’s approach implicitly argues that this interest income is part of the shareholder’s return stream.
Further, Huber’s exclusion of Goodwill / Intangibles makes the capital base smaller. Since Meta’s recent growth has been organic (CapEx) rather than acquisitive (M&A), the change in capital is similar, but the base efficiency looks higher under Huber’s lens.
Which metric you focus on depends on what the goal is:
If the goal is specifically to look at the returns on CapEx spend, then Mauboussin’s approach provides a clearer picture.
If the goal is to assess the productivity of all tangible assets (including cash), then Huber’s approach is superior.
Meta has guided for 2025 CapEx to be in the range of $70-$72 billion, which is a staggering increase from the ~$37B in 2024. The payoff for the 2025 spend should be judged by the NOPAT in 2026 and 2027, given the 18-24 month delay.
What About Reality Labs?
Mauboussin’s invested capital base calculation includes all of the Reality Labs investments, while Huber’s invested capital base would exclude some (intangibles).
This segment acts as a massive drag on consolidated returns, effectively a venture capital bet funded by the core business. If we isolate the Family of Apps (FoA), the ROIC likely exceeds 60%, positioning it among the highest-quality businesses in history.
However, the stability of the consolidated ROIC above 40% implies that the core business is robust enough to subsidize this bet without destroying aggregate shareholder value, provided the spread between ROIC and the WACC remains wide.
We view Reality Labs as optionality. Yes, the returns would be even higher without this loss-making segment, although it could also spawn the next generation growth segment for Meta.
Closing Thoughts
ROIC and ROIIC are not panaceas and do have their limitations.
Even so, they are among the best tools we have as long-term investors to measure value creation objectively.
More specifically:
ROIC is a good reflection of a company’s economic quality over its entire life.
ROIIC measures the quality of recent capital-allocation decisions and gives a glimpse of what the company is in the process of becoming.
Looking at the two side by side helps you judge whether its value-creation trajectory is improving, deteriorating, or broadly stable over time.
Meta’s trajectory from 2020 to 2024 offers us a textbook case study of theory in action. It shows us that Meta’s historical—and incremental—investments have created immense value. It appears that, overall, their AI investments are indeed paying off and investor concerns about their spend are unfounded.
The case study also highlights a methodological approach for tracking invested capital returns as a corporation shifts its strategy (for example, from capital-light to capital-intensive.)
Further, we can see how adjustments in working capital (Mauboussin vs Huber) are required depending on what specific information the investor is trying to parse out.
Each company is a unique case, and there are no universal rules.
That’s the good news: precisely because there isn’t a fixed playbook, time, experience, and a stubborn curiosity about how businesses really work can compound into a real edge.
“Investing is kind of a game of connecting the dots. The nice thing about it is the longer you are in the business, as long as you are intellectually curious, your collection of data points of dots gets bigger and bigger.”
Ted Weschler
And, don’t forget to check out Masters of Compounding!
Disclaimer: We are private investors and not financial advisors. This post is for educational purposes only and does not constitute financial advice. Meta Platforms, Inc (META) is a stock that The Pursuit of Compounding owns. Always conduct your own due diligence before making any investment decisions.
 | A guest post by
|
Solid read - I would add a couple of factors (as discussed in my December '25 e-book):
- impact of inflation vs. assets at historical cost; pricing power can significantly distort assumptions on future investment needs
- utilization rate vs. capacity (reflecting all assets and liabilities on the balance sheet); some companies will have leftover capacity post-COVID and will see their ROIIC increase if you're adjusting the numbers on a like-for-like basis
- not really a big fan of the year-over-year ROIICs because it can be distorted by timing of working capital management (could be payment timing during the holidays)
- not always easy to break down the profit growth coming from new investments or just optimizing the base business
It remains a very nuanced subject :))
Can ROIIC replace ROIC?
Is ROIIC superior than ROIC?
ROIC assesses total investments (old + new investments) whereas ROIIC new investment only which could be small in scale compared to the old investment.
Please explain why in detail.
What if ROIIC, (1+Gnp)/(1+Gic) & ROIC are assessed at the same time?
https://gemini.google.com/share/686374f17eb4